Tracking Inequities in COVID-19 Related Outcomes in Select U.S. Cities - Narrative Brief
Download the Brief
Overview
The COVID-19 pandemic has highlighted the multiple ways that structural factors such as racism and economic inequality drive health inequities. Inequities in COVID-19 outcomes (testing, incidence, hospitalizations, and mortality) emerged early in the pandemic. A first step in addressing these inequities is to describe and quantify their magnitude in order to create public awareness and identify the factors and policies that may be most effective in eliminating them. Comparing inequities across different cities can be especially valuable in understanding drivers, targeting resources, and identifying effective policies.
The Urban Health Collaborative (UHC) has created the COVID-19 Health Inequities in Cities Dashboard. The dashboard enables visualizations that allow users to compare key COVID-19 outcomes, and specifically inequities in outcomes over time and across cities that are a part of the Big Cities Health Coalition (BCHC). Users can compare inequities between groups of individuals (for example by race and ethnicity), by neighborhoods and neighborhood characteristics (for example by neighborhood poverty or segregation), or across cities (for example by comparing cities with more income inequality to those with less income inequality). Each of these types of comparisons, and how they evolve over time, is important to understand the causes of inequities and what we can do to reduce and eliminate them.
More details on the UHC COVID-19 Equity Framework can be found by visiting the dashboard: https://drexel.edu/uhc/covid-inequities.
About the Dashboard
The COVID-19 Health Inequities in Cities dashboard provides descriptive data of how COVID-19 related outcomes, and especially inequities in these outcomes, are evolving in the BCHC cities. We use available data to characterize, compare, and track inequities along three dimensions (1) across subgroups of individuals within cities; (2) across neighborhoods within cities, and (3) across cities. You can view the dashboard by visiting the website: https://drexel.edu/uhc/covid-inequities.
Sections include:
- City Reports
- Trends Across Cities
- Individual Level Inequities
- Neighborhood Level Inequities
- City Level Inequities
Interactive visualizations in the dashboard allow users to select variables or cities, and provide tooltips to assist in interpretation.
City Reports
The City Reports section focuses on displaying data for each city separately. Depending on the city and data available, the dashboard provides visualizations of:
1) trends in cases, deaths, and hospitalizations over time
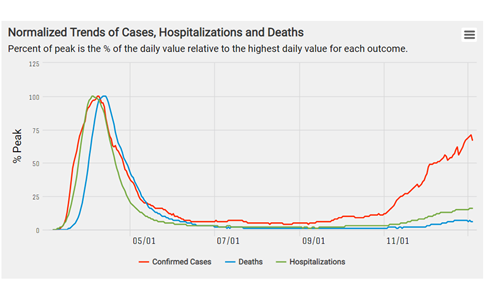
This figure tracks trends in COVID-19 outcomes and presents various outcomes as percent of peak (% of the daily value relative to highest daily value for each outcome). Here we see that daily trends in deaths lag behind daily new cases by about two weeks.
2) trends in testing and positivity rates over time
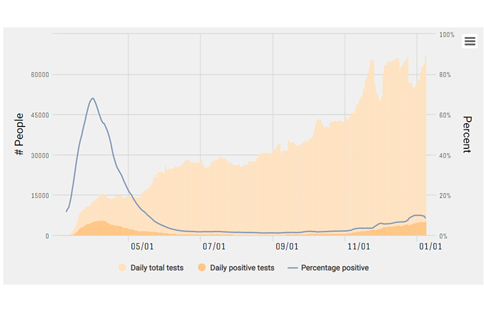
Test positivity ratio (percentage of total COVID-19 tests that are positive) is a key COVID-19 indicator which captures whether levels of testing are keeping up with levels of transmission. Here we can see that for New York City test positivity ratio (blue line) was highest between March and May but dropped significantly after May.
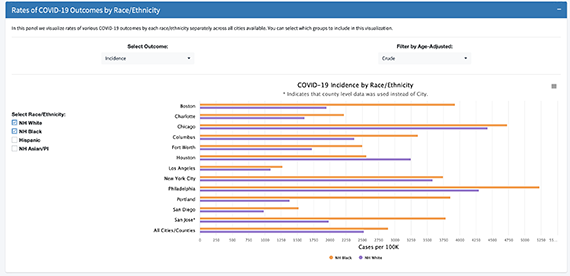
3) inequities by race/ethnicity
This panel shows cumulative rates of COVID-19 outcomes by race and ethnicity for the selected city. Here we see that in New York City, Hispanics and non-Hispanic Blacks have higher age-adjusted cumulative incidence rates than non- Hispanic whites.
4) inequities across neighborhoods
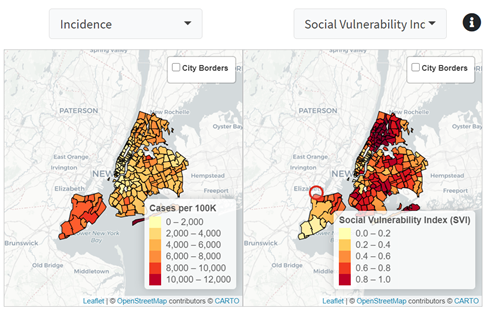
These maps display the spatial heterogeneity in neighborhood level COVID-19 outcomes (left) and neighborhood characteristics (right). Here we can see that
in New York City, mortality and social vulnerability are spatially co-located: more vulnerable neighborhoods tend to have higher COVID-19 mortality.
Trends Across Cities
This section focuses on comparing COVID-19 trends across cities and across groups of cities that share certain characteristics (e.g., by region of the country or city size). For example, the user can compare daily new cases across different cities or examine how the total number of new cases is distributed across different sized cities over time.
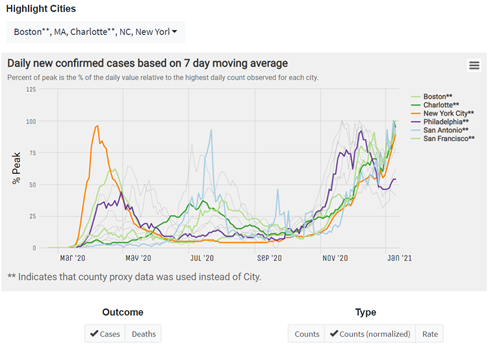
Users can highlight cities of interest to compare trends in COVID-19 outcomes across cities. In this figure we can see that New York reached its peak daily incidence rate in late March but had a new increase in cases in November. In contrast, San Francisco had a smaller increase in March, a second wave in August, and its most severe peak as of late December.
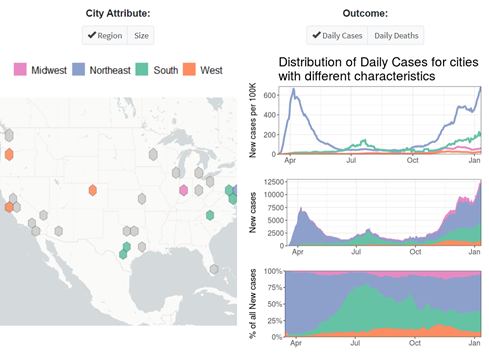
This figure displays trends in COVID-19 outcomes by city characteristics. Here we aggregate cities based on region and show that earlier in the pandemic (March and June) the Northeast had much higher incidence relative to other regions. Shortly after, cases started rising in the South, especially during the summer and early fall.
Individual-Level Inequities
Key individual-level indicators used to describe health inequities include race and ethnicity and measures of socioeconomic position including education, occupation, income, and wealth. Based on data availability, the dashboard focuses on race and ethnicity. For example, the user can observe how incidence rates in Black populations differ from city to city, and also compare the size of the Black-white inequity across cities.
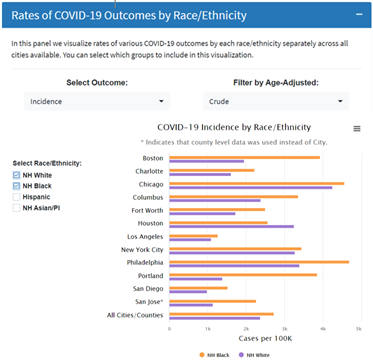
This panel shows cumulative rates of COVID-19 outcomes by race and ethnicity across cities. Here we see that in almost all cities displayed, non-Hispanic Blacks have a higher cumulative incidence rate than non-Hispanic whites.
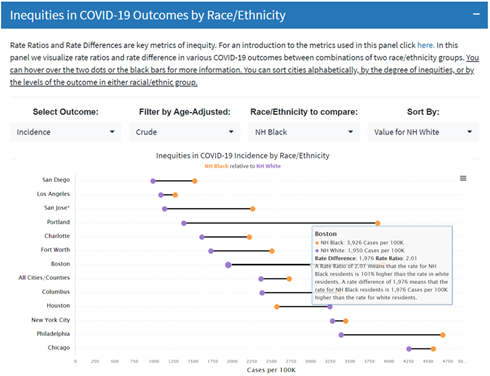
We can also display differences in COVID-19 outcomes between race and ethnic groups for each city. By hovering over the dots in each city, users can view a more detailed interpretation of inequities. For example, in Boston the incidence rate for non-Hispanic Black residents is 101% higher than the rate in non-Hispanic white residents.
Neighborhood-Level Inequities
This section of the dashboard describes inequities across neighborhoods using neighborhood-level data. Due to data availability, zip codes are used to approximate neighborhoods. Key neighborhood indicators often used to describe neighborhood health inequities include measures of neighborhood income, education, occupation, and segregation. Several of these neighborhood features (and others such as overcrowding, English proficiency, and access to public transportation) may affect COVID-19 outcomes.
For each city, the user can contrast COVID-19 outcome rates in the most advantaged compared to the least advantaged neighborhoods. The magnitude of these differences can be compared across cities.
This figure compares COVID-19 incidence rates in the most socially vulnerable neighborhoods vs. the least socially vulnerable neighborhoods, across several cities. By hovering over the dots in each city, users can obtain a more detailed interpretation of neighborhood level inequities. For example, in San Diego the incidence rate is 251% higher in the most socially vulnerable neighborhoods compared to the least socially vulnerable neighborhoods. Details of the selected neighborhood characteristic can be found by hovering over the black information bubble (“i”).
City-Level Inequities
Cities are heterogeneous in terms of residents and neighborhoods. They also have unique city-level characteristics that may affect health. City-level characteristics that may be related to differences in health (and COVID-19 outcomes) across cities include: city poverty rates, income inequality, population density, race and ethnic composition and city-level segregation. This section of the dashboard displays inequities in COVID-19 outcomes between cities categorized by top and bottom quartiles of selected city-level characteristics.
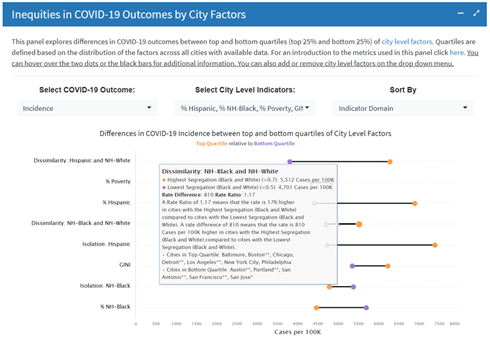
This example compares COVID-19 incidence rates in cities located in the top quartile vs. cities located in the bottom
quartile of selected city- level characteristics. By hovering over the dots in each city, the user can obtain a more detailed interpretation of city- level inequities. For example, the rate is 15% higher in cities in the highest quartile of poverty compared to cities with the lowest quartile of poverty.
Limitations
Surveillance data collected during a pandemic can have a number of limitations. Differences in access to testing may result in underestimation of incidence rates in certain neighborhoods or groups. The evaluation of multiple indicators (e.g., positivity and incidence) can provide a more complete picture of COVID-19 inequities. Data quality and missing data can also affect comparisons. For example race/ethnicity data is missing for some tests, cases, hospitalizations, or deaths. In the individual- level inequities tab, we provide a visualization of the proportion of outcomes missing data on race/ethnicity.
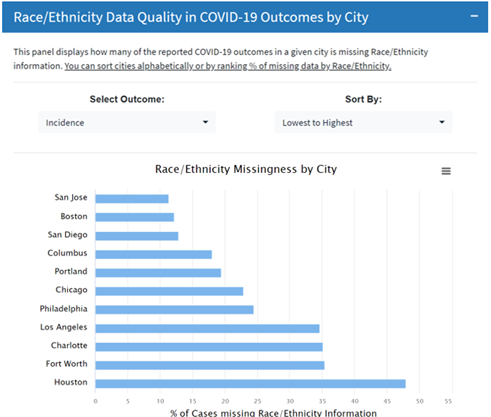
Users can view the proportion of data that has missing race/ethnicity for various COVID-19 outcomes (tests, cases, hospitalizations, deaths). This example compares the proportion of confirmed cases that have missing race/ethnicity information for select cities. We see that the in the city of Houston 48% of confirmed cases are missing race/ethnicity information.
UHC and BCHC Partnership
The Dornsife School of Public Health (DSPH), through its Urban Health Collaborative (UHC), has partnered with the Big Cities Health Coalition (BCHC) to support the Coalition’s vision of healthy, more equitable cities through big city innovation and leadership. BCHC is a forum for the lead health officials of 30 of America’s largest metropolitan health departments to exchange strategies and jointly address issues to promote the health and safety of the 62 million people they serve. The UHC is a multidisciplinary research and practice center that leverages the power of data, research, education, and partnerships to make cities healthier, more equitable, and environmentally sustainable.
The COVID-19 dashboard will continue to be updated and expanded in the coming months, including the integration of data on COVID-19 testing in BCHC cities. In addition to the development of the COVID-19 dashboard, the UHC is currently working on several initiatives with BCHC as part of a strategic partnership. The UHC is conducting a needs assessment with BCHC member cities to better understand their urban health needs and priorities to help inform a national urban health agenda. The UHC is also redesigning the existing Big Cities Health Indicators Data Platform to maximize value to BCHC members and complement other sources of city data. Eventually, the COVID-19 dashboard will be integrated into the Big Cities Health Indicators Data Platform.
Barber, S., Bilal, U., Diez Roux, A., Furukawa, A., Koh, C., Kolker, J., Li, R., McCulley, E., Rollins, H., Schnake-Mahl, A., Sharaf, A., Vaidya, V. (2021). Tracking Inequities in COVID-19 Related Outcomes in Select Cities. Urban Health Collaborative.
6Urban Health Collaborative.